Fundamentals of Spectral Impedance
The impedance of an electrochemical cell, e.g. a battery, depends on the frequency and increases with decreasing frequency. The impedance has ohmic and capacitive / inductive components; it is therefore measured according to its amount and phase or – more common in electrochemistry – according to the active component and reactive component.
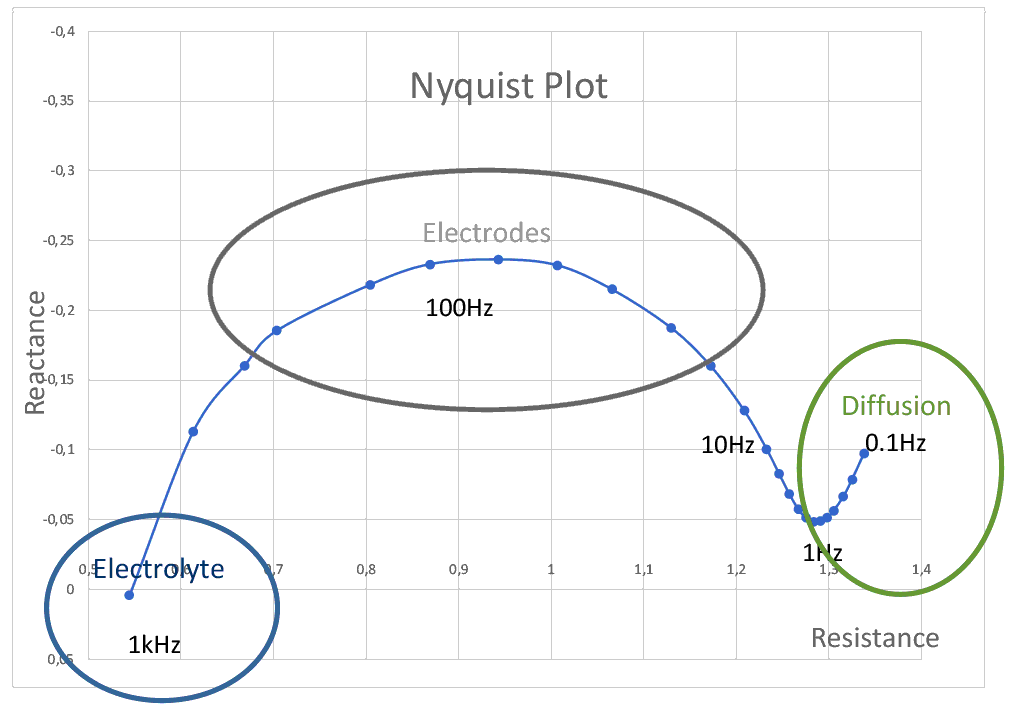
The frequency response is often represented in the form of a Nyquist plot: the abscissa shows the ohmic (active) component, the ordinate the capacitive (reactive) component. The frequency is a parameter and decreases to the right.
There are 3 areas, each of which represents a specific property of a cell:
- The high frequencies (≈1kHz) show the influence of the electrolyte
- The middle frequencies (100Hz … 10Hz) represent the electrodes
- The low frequencies (1Hz … 0.1Hz) represent diffusion effects.
On the basis of the Nyquist plot, changes in the state can be inferred easily and clearly.


